Cloud Observability
A unified cloud observability platform provides full visibility into the health and performance of each layer of your environment at a glance.
Design Challenge Story
Designer after assigned to the new project they should fully grasp the product and explain the problem and solution all within a day or week.
Let's start with a short story:
Design is about telling stories, so let me first frame this design challenge by telling you a story.
The engineer has successfully deployed their application to a cloud platform (AWS, Azure, GCP, etc.). The app is running, users are accessing it, but they're flying blind - they don't have proper monitoring in place.
The Wakeup Call Moment
App is down Users report the application is unavailable, but the engineer had no signal that anything was wrong.
Performance complaints Users say the app is slow, but there is no clear trail to show when the slowdown started or what caused it.
Unexpected cloud bills Monthly costs increase, but there is no visibility into which services or workloads are driving the spike.
Deployment failure New code goes out, something breaks, and the engineer cannot quickly connect the change to the issue.
Why?
Is my application up and running?
How is my application performing?
What's causing this slowdown?
How much am I spending on the cloud?
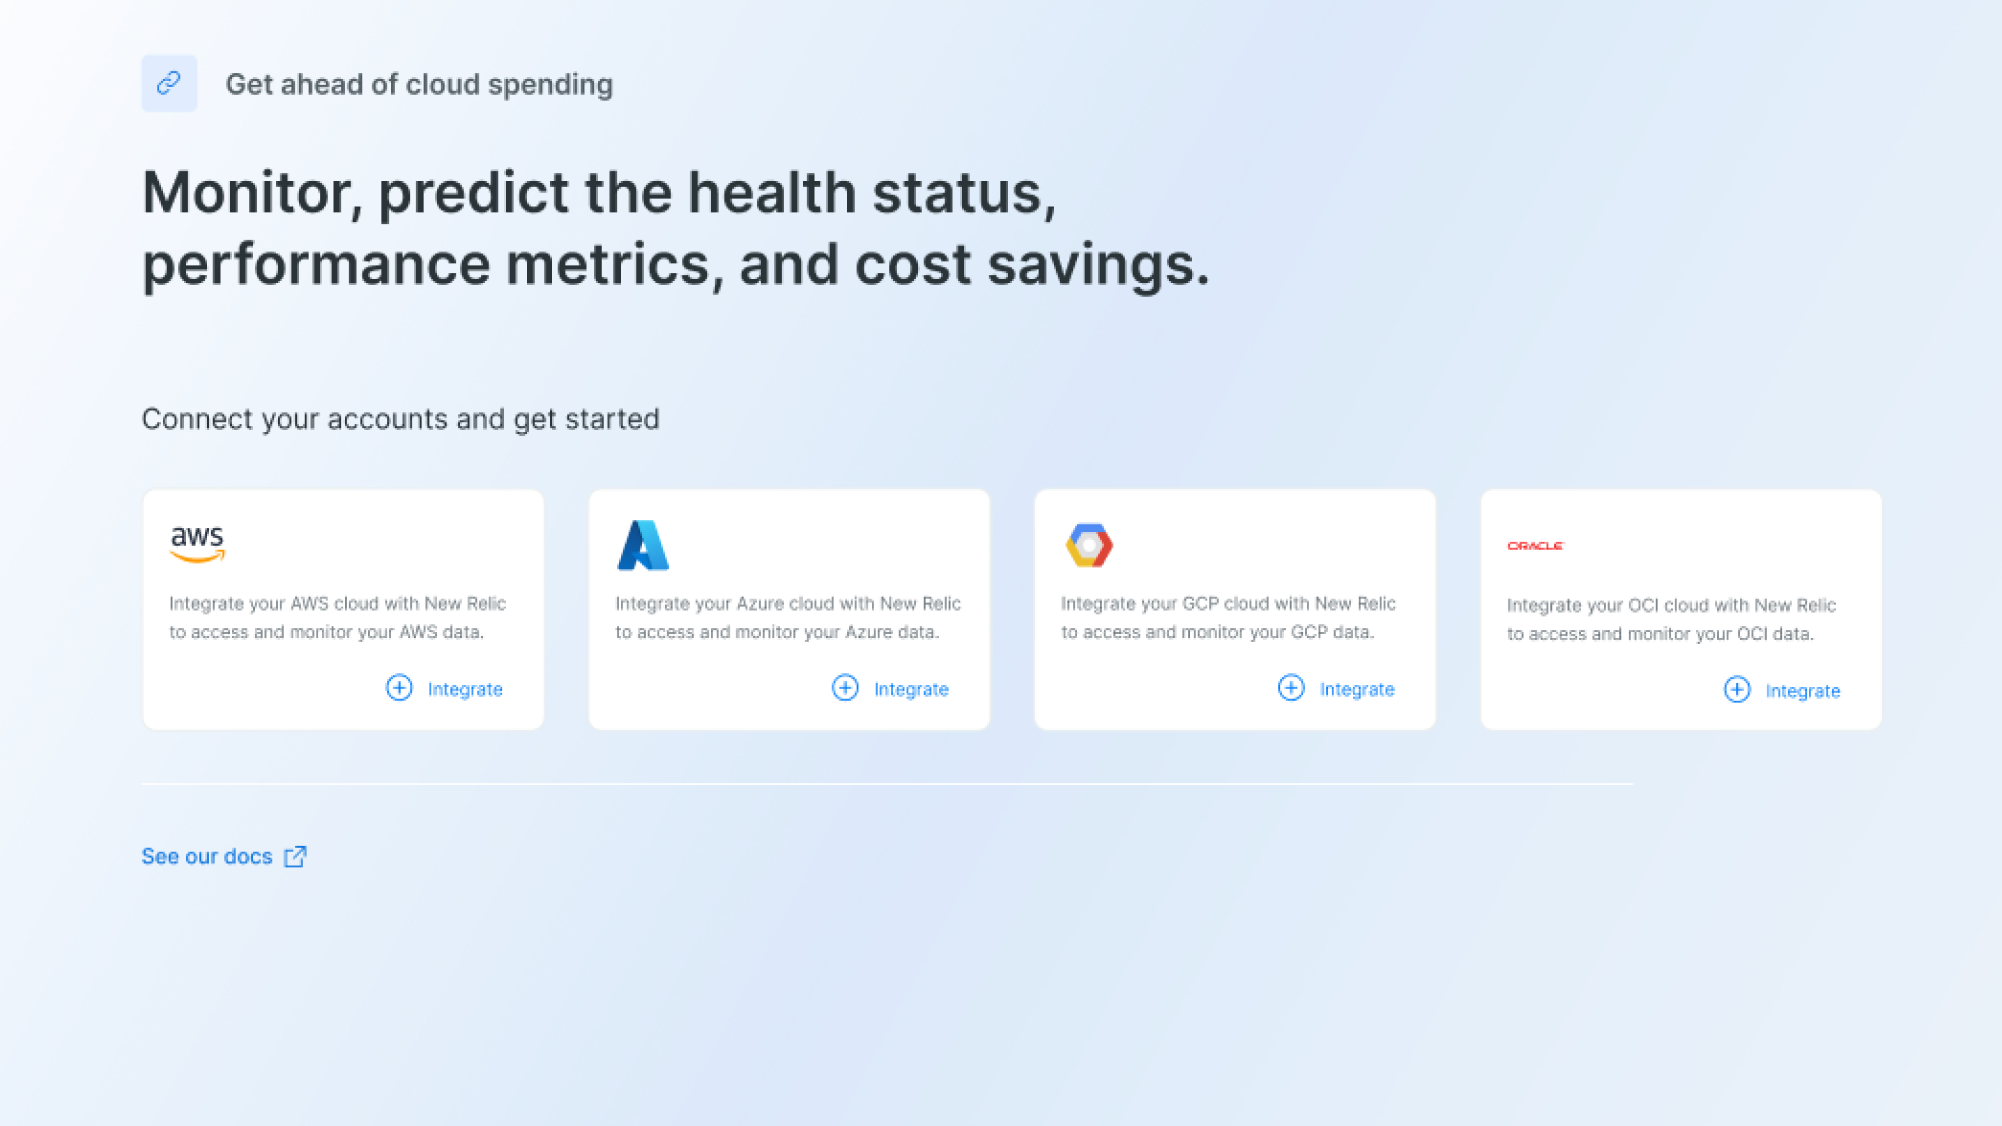
Solution
The engineer starts researching monitoring solutions and discovers NEWRELIC.
First Draft: Sketches
I've started by drawing some sketches to have an idea on how the main user flow could work. Hand-drawn sketches are great to move forward very fast and try completely different layout and content structures.
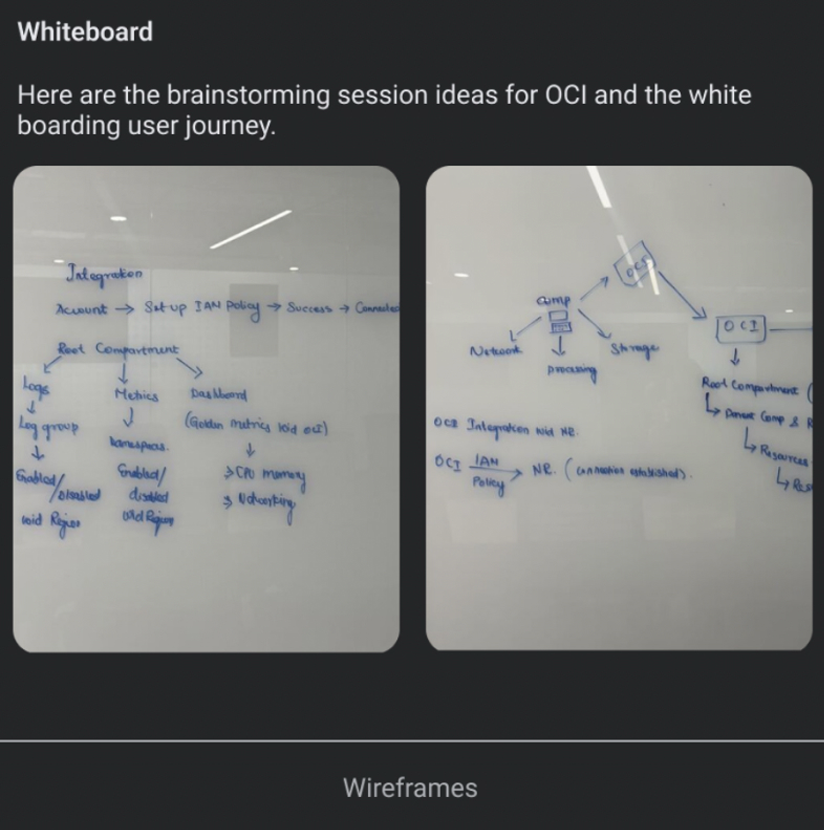
Sketches are useful to start organizing ideas and shape an overview of how everything will work. I usually find it better to write down how things could work than directly jumping to move pixels on any design tool.
Mockups
Next step is creating mockups. In this phase is where your design starts to feel like a real product. I've decided to place the widgets in the top. Ai insights From there, users can get to a detail view and check their risk and criticality of the product. To access between the charts user has to switch between the charts, Application risk details tells about the drill down of data.
Figma LinkOur Customers